Users Overview Dashboard
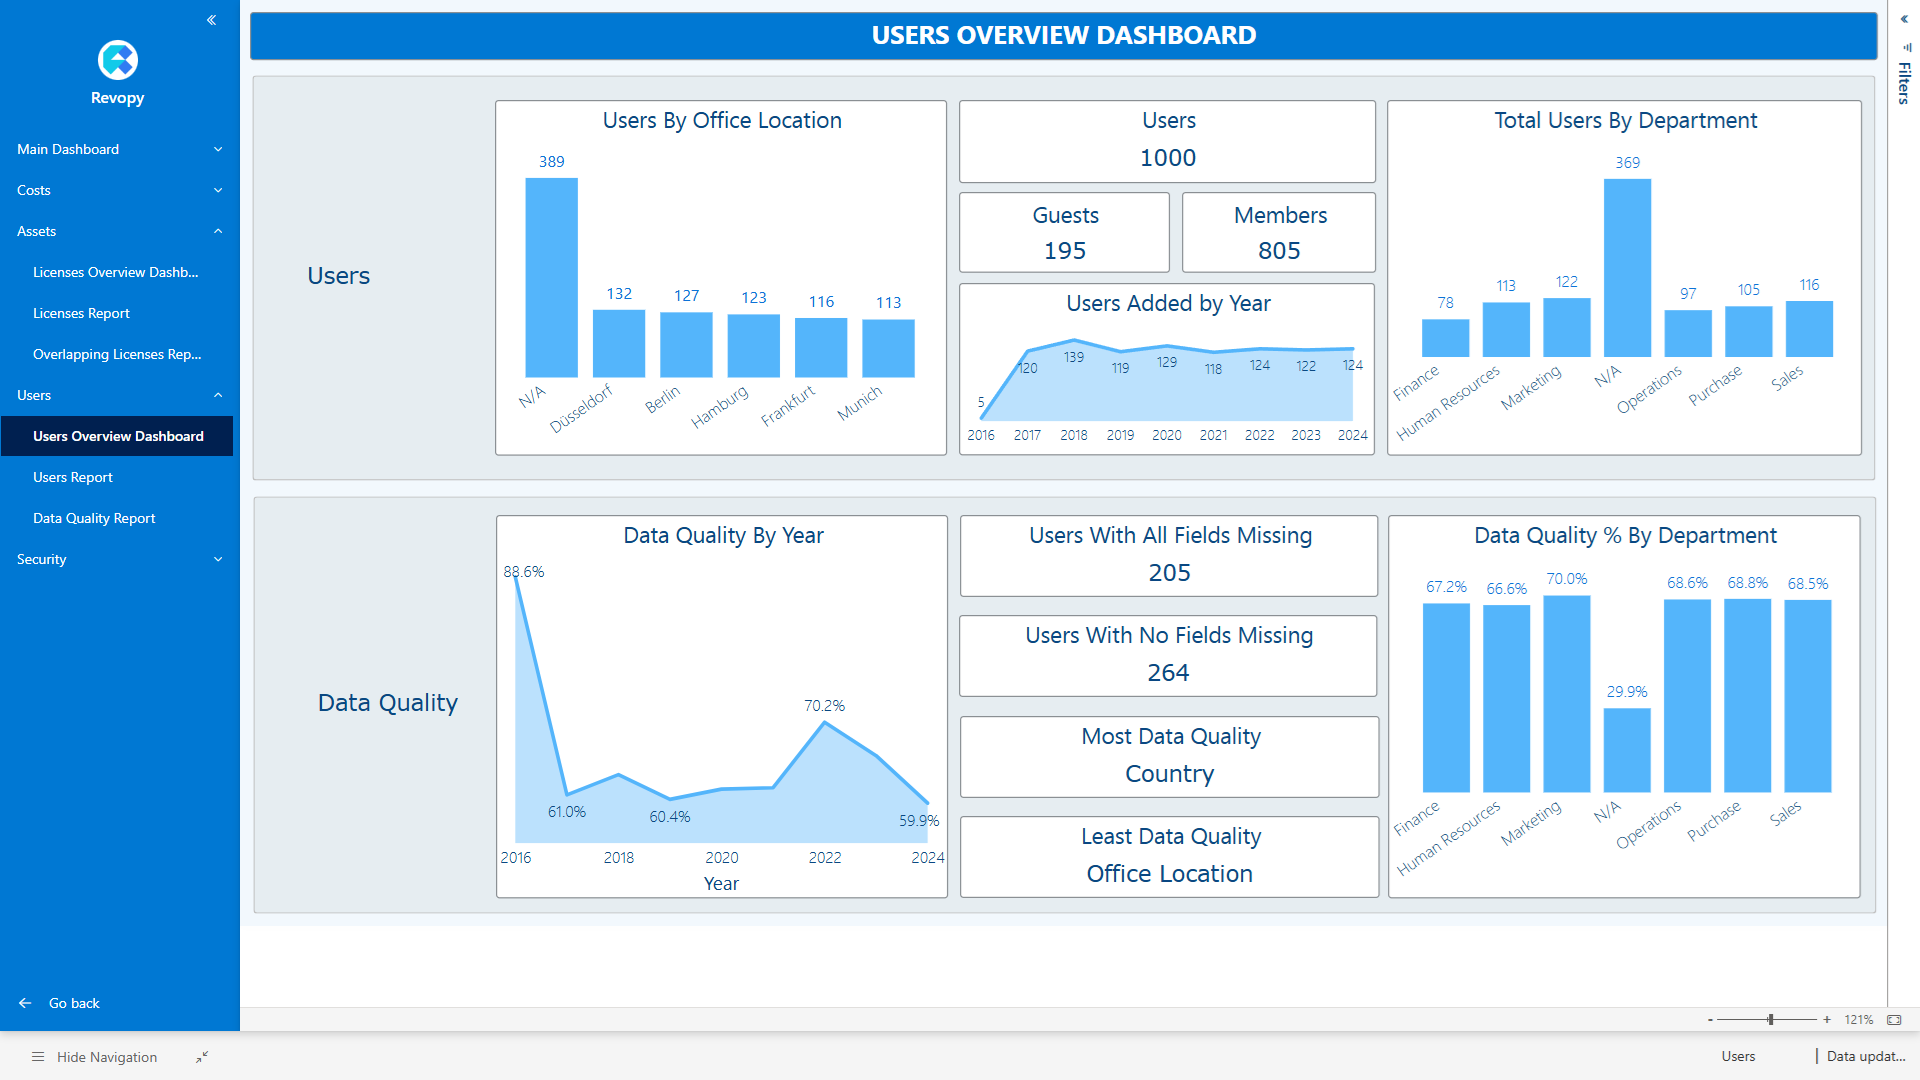
The Users Overview Dashboard focuses on understanding how users are licensed and identifying potential data inconsistencies. It includes two key areas: Users and Data Quality, offering both operational insight and data reliability checks.

Core Areas
Users
This section provides an overview of all users in your Microsoft 365 tenant, including license assignments, user activity, and key stats like inactive or unlicensed users. It helps you track how licenses are distributed across your user base and detect possible inefficiencies.
Data Quality
Highlights inconsistencies or missing information in user records—such as missing department names, duplicate user entries, or incomplete license data. Ensuring high data quality is essential for accurate reporting and better decision-making.
Metrics Included
01. Users
- Users by Office Location: Displays the number of users grouped by their office locations, helping you understand the geographical distribution of your user base.
- Users: The total number of users in your Microsoft 365 tenant, providing a snapshot of your user base.
- Guests: The total number of guest users in your Microsoft 365 tenant, helping you understand the extent of external collaboration.
- Members: The total number of member users in your Microsoft 365 tenant, providing a snapshot of your internal user base.
- Users Added by Year: The number of new users added to your Microsoft 365 tenant each year, helping you track user growth over time.
- Total Users By Department: Displays the number of users grouped by their departments, helping you understand how users are distributed across your organization.
02. Data Quality
- Data Quality By Year (%): The percentage of data quality identified in your Microsoft 365 tenant each year, helping you track improvements or declines in data quality over time.
- Users With All Field Missing: The number of users with all fields missing in their records, indicating potential data quality issues.
- Users With No Field Missing: The number of users with no missing fields in their records, indicating high data quality.
- Field With Best Data Quality: The field with the highest data quality in your Microsoft 365 tenant, helping you identify areas of strength.
- Field With Worst Data Quality: The field with the lowest data quality in your Microsoft 365 tenant, helping you identify areas for improvement.
- Data Quality % By Departament: The percentage of data quality by department, helping you understand how data quality varies across different parts of your organization.