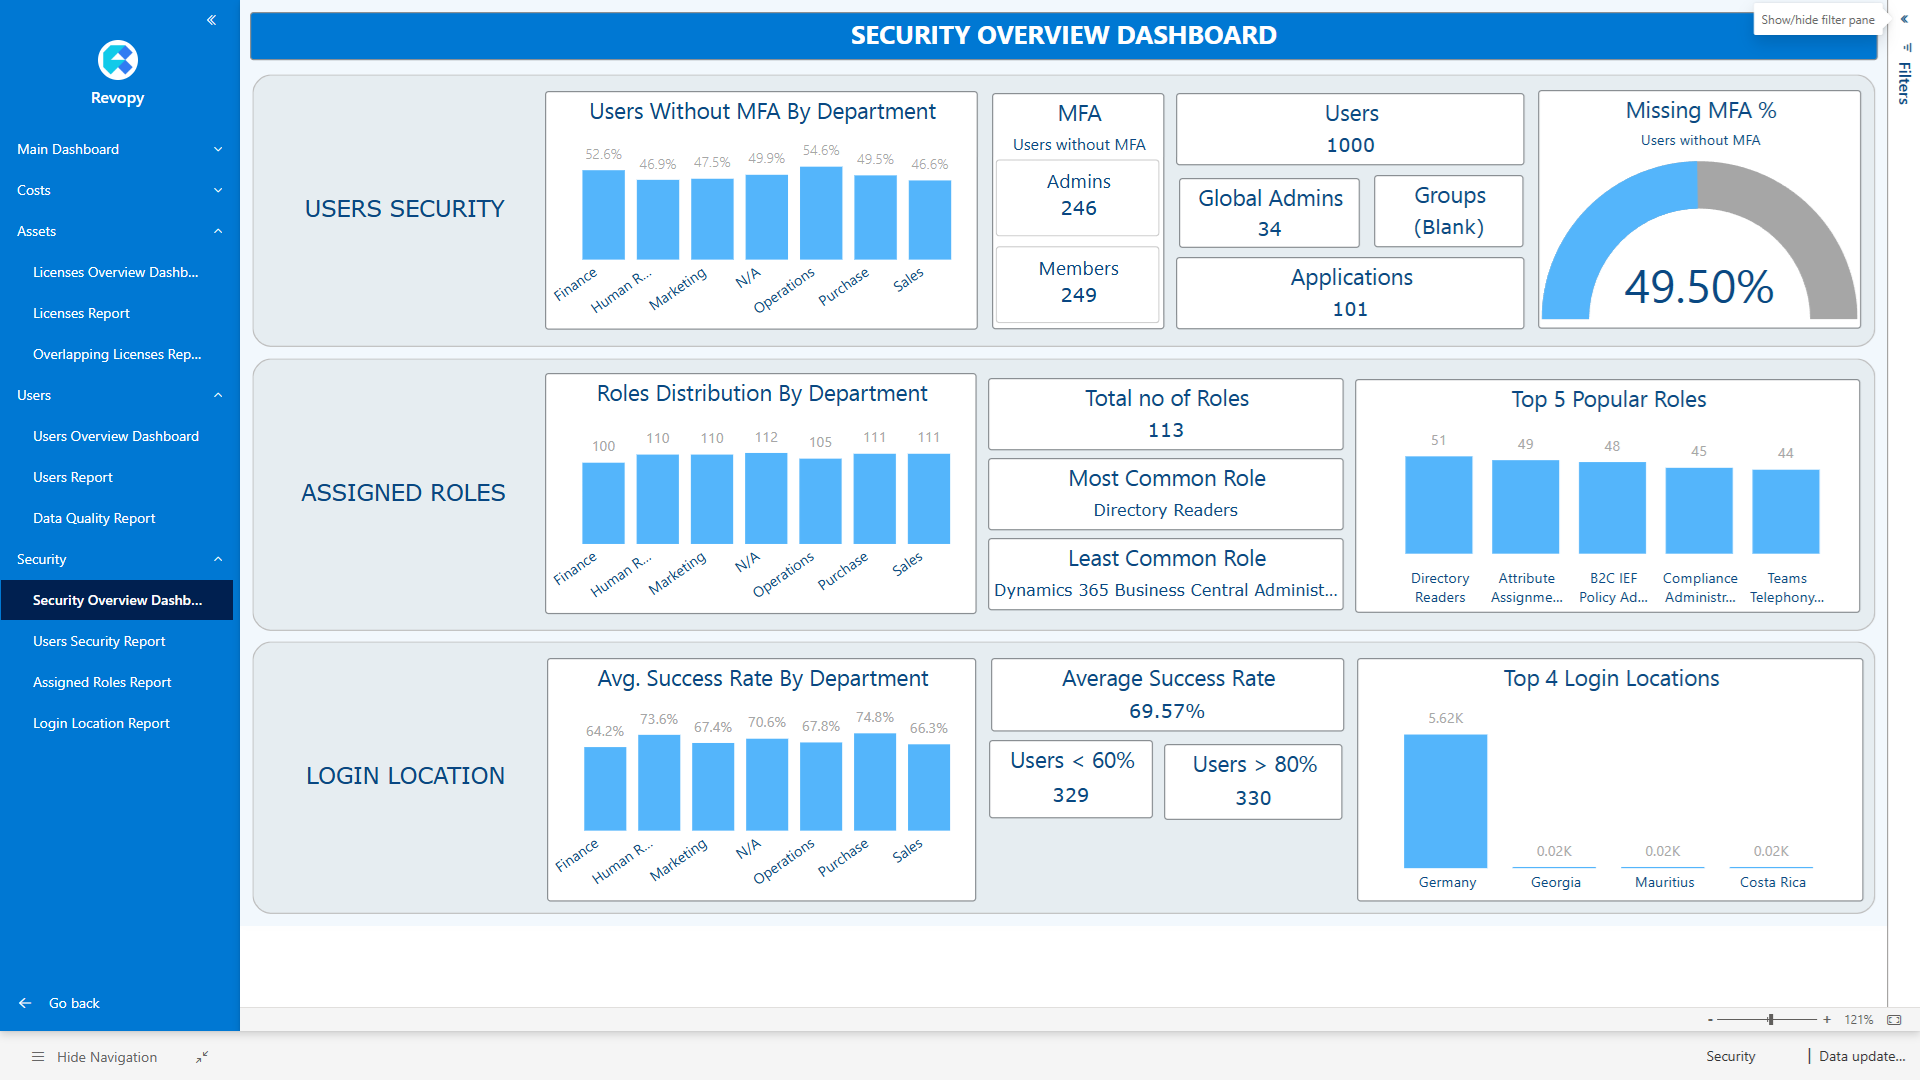
Security Overview Dashboard
The Security Overview Dashboard helps you monitor key aspects of your Microsoft 365 tenant’s security posture. It brings together insights from three critical areas: Users Security, Assigned Roles, and Login Location, making it easier to detect potential risks and take action.

Core Areas
Users Security
Displays metrics related to risky users, security misconfigurations, and other security-related issues. This section helps you identify users who may pose a risk to your organization due to the security settings applied to their accounts.
Assigned Roles
Shows how administrative and privileged roles are distributed across users. It helps ensure that high-permission roles are properly assigned and highlights any users with excessive or unnecessary access.
Login Location
Provides an overview of user sign-in locations, helping detect unexpected geographic access patterns that could indicate compromised accounts or risky behavior.
Metrics Included
01. Users Security
- Users Without MFA By Department: The number of users without Multi-Factor Authentication (MFA) enabled, grouped by department. This graph helps identify departments that may be at higher risk due to lack of MFA.
- Admins Without MFA: The number of administrators without MFA enabled. This metric is crucial for identifying high-risk accounts that could lead to significant security breaches.
- Members Without MFA: The number of regular users without MFA enabled. This metric helps identify potential vulnerabilities in your user base.
- Global Admins: The total number of global administrators in your Microsoft 365 tenant.
- Groups: The total number of groups in your Microsoft 365 tenant.
- Applications: The total number of applications in your Microsoft 365 tenant.
- Missing MFA %: The percentage of users without MFA enabled, providing a quick overview of your tenant's security posture.
02. Assigned Roles
- Roles Distribution By Department: Displays the distribution of roles across different departments, helping you understand how administrative privileges are allocated.
- Total No of Roles: The total number of roles assigned in your Microsoft 365 tenant, providing a snapshot of your role management.
- Most Common Roles: The most frequently assigned roles in your Microsoft 365 tenant, helping you identify common role assignments.
- Least Common Roles: The least frequently assigned roles in your Microsoft 365 tenant, helping you identify uncommon role assignments.
- Top 5 Popular Roles: The five most popular roles in your Microsoft 365 tenant, providing insight into role distribution.
03. Login Location
- Avg. Success Rate By Department: The average success rate of logins by department, helping you identify departments with potential login issues.
- Average Success Rate: The average success rate of logins across your Microsoft 365 tenant, providing a snapshot of login performance.
- Users < 60%: The number of users with a login success rate below 60%, indicating potential issues with those accounts.
- Users > 80%: The number of users with a login success rate above 80%, indicating healthy login performance.
- Top 4 Login Locations: The four most common login locations for users in your Microsoft 365 tenant, helping you understand where users are accessing their accounts from.